Mary Cummins, Real Estate Appraiser, Animal Advocates, Los Angeles, California

Mary Cummins, Real Estate Appraiser, Animal Advocates, Los Angeles, California
WEBSITE       RESUME       CONTACT       FACEBOOK        LINKEDIN       
Showing posts with label map. Show all posts

Monday, August 9, 2021

Measuring, describing land using metes and bounds, PLSS, lot and block and parcel numbers by Mary Cummins

mary cummins, real estate, appraiser, los angeles, california, plss, metes and bounds, land, real estate, real property, public land survey system, tax assessor parcel number, apn, lot, block, map, plot, plat, subdivision, tract, prime meridian, base line, section, township, range, tax assessor, parcel, assessor, survey, measure, describe, book, page, how to read, los angeles county


The original means of property descriptions and measurements in the US was the metes and bounds method. Metes and bounds was originally used in England for centuries then brought to the US with the first colonies. The "metes" are the length of the runs in a direction and the "bounds" are the boundaries. Below is an example of an older metes and bounds description of property one might find in a 17th century US land deed.

"Commencing at a corner at the intersection of two stone walls near an apple tree on the north side of Muddy Creek road one mile above the junction of Muddy and Indian Creeks, thence north for 150 rods to the end of the stone wall bordering the road, thence northwest along a line to a large standing rock on the corner of the property now or formerly belonging to John Smith, thence west 150 rods to the corner of a barn near a large oak tree, thence south to Muddy Creek road, thence down the side of the creek road to the point of commencement." 

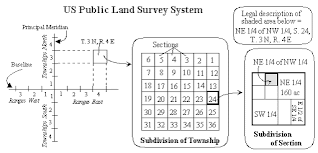
Modern day property measurement and description use the government survey system or Public Land Survey System PLSS. The PLSS system is based on set principle meridian and base lines across the US based on exact locations using longitude and latitude. Using the base lines the land is divided into sections, townships and ranges, see image above.

A section is one-square-mile block of land. There are 36 sections in a survey township. A township is a square parcel of land of 36 square miles, or a measure of the distance north or south from a referenced baseline, in units of six miles. See image below.

mary cummins, real estate, appraiser, los angeles, california, plss, metes and bounds, land, real estate, real property, public land survey system, tax assessor parcel number, apn, lot, block, map, plot, plat, subdivision, tract, prime meridian, base line, section, township, range, tax assessor, parcel, assessor, survey, measure, describe, book, page, how to read, los angeles county


An example of the PLSS description would be "the Northeast quarter of the Northeast quarter of Section 10, Township 3 South, Range 68 West of the 6th Principal Meridian, Arapahoe County, Colorado" or "NE/4 NE/4 of Section 10, T-3-S, R-68-W, 6th P.M., Arapahoe County, Colorado." 

In the city the most common type of legal property description and measurement is the subdivision tract, lot and block method. After describing land using PLSS it's further divided into smaller tracts of land which are then divided into lots and blocks via plat maps. A plat map, also known as a “plat,” shows you how a tract of land is divided into lots in your county. It is drawn to scale and records the land's size, boundary locations, nearby streets, flood zones, and any easements or rights of way. A plot map is a single plot or piece of land. Below is a description of real property using the subdivision and lot names and numbers. Subdivisions or tracts can have regular names such as "Highland Park" or use numbers. 

Lots 6, 7, and the South ½ of Lot 3, West 60 feet of South ½ of Lot 4, West 60 feet of Lot 5 and Lot 8, Block 20, OLD SURVEY, Leesville, Vernon Parish, Louisiana.

If it were just one full lot in a subdivision, the description could be just TRACT # 14386 LOT 286.  

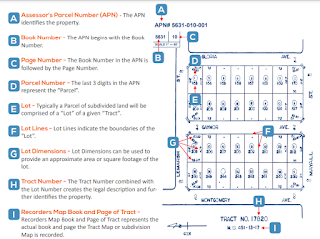
We also use the Tax Assessor Parcel Number (APN) to describe property. The APN uses the Tax Assessor’s Book Number, Page Number and the individual Parcel Number. An example of a parcel number in Los Angeles county would be 4248-005-021 where the first four numbers are the book number, next three are the book page number and the last number is the parcel number. Below is an image which explains Los Angeles County plat maps. Click to see larger. 

mary cummins, real estate, appraiser, los angeles, california, plss, metes and bounds, land, real estate, real property, public land survey system, tax assessor parcel number, apn, lot, block, map, plot, plat, subdivision, tract, prime meridian, base line, section, township, range, tax assessor, parcel, assessor, survey, measure, describe, book, page, how to read, los angeles county

Here's a specific example of a Los Angeles county legal description and APN. I'm using a property that includes parts of two lots to make it more complex. The legal description is "WESTMORELAND HEIGHTS TRACT S 41 FT OF LOT 43 AND N 20 FT OF LOT 44." This is an old tract so it has a name instead of a number. The Assessor's Parcel Number is 5074-019-004. The last number of the APN is in the pink circle, i.e. 4. The red arrow is pointing to the specific piece of land. It's the south 41 feet of lot 43 and the north 20 feet of lot 44. You can see the measurements on the lot lines, i.e. 20' x 41'. You see a lot tie or hook symbol in between lots 43 and 44 which shows the lots are tied together. It looks like a tall "Z" like this image and can be angled like an italic "Z." Click images to see larger. 


When you buy real estate you are actually buying only the land. Legally this entitles you to anything permanently affixed to the land. If you look at a real estate deed you will only see the legal description and the tax assessor parcel number. You don't see a description of the home or any other structures on the land. In the US the main types of land descriptions and measurements are the Public Land Survey System PLSS, lot & block description and tax assessor parcel map and numbers. 

Mary Cummins of Animal Advocates is a wildlife rehabilitator licensed by the California Department of Fish and Game and the USDA. Mary Cummins is also a licensed real estate appraiser in Los Angeles, California.


Google+ Mary Cummins, Mary K. Cummins, Mary Katherine Cummins, Mary Cummins-Cobb, Mary, Cummins, Cobb, wildlife, wild, animal, rescue, wildlife rehabilitation, wildlife rehabilitator, fish, game, los angeles, california, united states, squirrel, raccoon, fox, skunk, opossum, coyote, bobcat, manual, instructor, speaker, humane, nuisance, control, pest, trap, exclude, deter, green, non-profit, nonprofit, non, profit, ill, injured, orphaned, exhibit, exhibitor, usda, united states department of agriculture, hsus, humane society, peta, ndart, humane academy, humane officer, animal legal defense fund, animal cruelty, investigation, peace officer, animal, cruelty, abuse, neglect #marycummins #animaladvocates #losangeles #california #wildlife #wildliferehabilitation #wildliferehabilitator #realestate #realestateappraiser #realestateappraisal #lawsuit

Tuesday, May 18, 2021

Redlining in home loan financing - Mary Cummins, Real Estate Appraiser, Los Angeles, California


UPDATE: 08/12/2023 AEI just posted an op-ed about redlining. It stated only 20% of people living in redlined areas at the time were black owners. I previously stated most who owned property in redlined areas were white. Now we know it was 80% which proves my point with research. Whites were primarily negatively affected by redlining because whites owned the property. This proves that blacks were not the target or "victim" of redlining.

This also shows that blacks and others were pushed into these areas because they were cheaper to rent. That is why they were drawn to those areas. No one corralled them into these areas. Poor whites, Latinos, newer immigrants were also in these same areas for the same reasons. Redlining did not cause the areas to deteriorate.

“Our results suggest that racial bias in the construction of the HOLC maps can explain at most 4 to 20 percent of the observed concentration of Black households in the lowest-rated zones. Instead, our results suggest that the majority of Black households were located in such zones because decades of disadvantage and discrimination had already pushed them into the core of economically distressed neighborhoods prior to the federal government’s involvement in mortgage markets.”

Redlining did not keep black people from owning homes. "However, there was a robust growth of black home ownership during the postwar era; continuously increasing from 21% in 1940 to 54% by 1980."

Another point is the condition of the homes in primarily black owned areas. They previously were middle class white areas which experienced deterioration and decline which is a natural real estate cycle. This made the properties cheaper and blacks and others were more easily able to afford to rent them. Some even owned them. Redlining didn't cause this. It's just a real estate cycle which happens all over the world. Blacks, Latinos ended up reaping the benefit of buying the depreciated homes when the areas went through the revitalization stage and greatly increased in value. They sold the properties at a large profit.

"Unlike the Oliver-Shapiro assertion that “their homes and communities deteriorated and lost value,” many of these black neighborhoods were previously upper-middle class ones. This filtering down housing process provided a financial foundation for many black families. And when the professional classes chose to repopulate some of these neighborhoods, black homeowners, including Washington DC’s Shaw district, reaped the gains from further housing appreciation."

Another interesting point is the wealth gap between whites and blacks. It's not caused by the median or average family wealth differences. It's mainly caused by the upper class wealth. I would bet that most of the overall wealth gap is driven by the 5% most wealthy people who are white. If you removed people worth over $5,000,000, the wealth gap would shrink immensely. It's probably the billionaires driving most of the wealth gap.

"The left-wing blogger Matt Bruenig found that if black households in the lower half of their distribution had their wealth raised to be exactly the same as white households in their lower half, the overall racial wealth gap would be reduced by just 3 percent. As a result, he concluded, “What this shows is that 97 percent of the overall racial wealth gap is driven by households above the median of each racial group.” Indeed, over two-thirds of racial gap reflects the differences in assets held by the top ten percent of households in each group. Class, not race is the major driver of wealth inequality. "

Another reason for the wealth gap is the difference in family structure. Couples have more money than single people.

"To be sure, racial disparities in home ownership rates persist. But a significant share can be explained by family structure. In 2022, overall black homeownership was 44 percent; but for married couples it was 64 percent, virtually the same as the overall white homeownership rate. "


ORIGINAL: Redlining - Definition: To refuse (a loan or insurance) to someone because they live in an area deemed to be a poor financial risk.
The National Housing Act of 1934 created the Federal Housing Administration FHA to help revive the US economy after the Great Depression. The purpose of the FHA was to provide affordable loans so people could buy homes. Private lenders would make the loans and the federal government would insure them for losses. The new loans would have lower down payments, smaller monthly payments and were more affordable.
President Roosevelt's New Deal created the Home Owners Loan Corporation to help process the home loans. "To facilitate private investment through the FHA, the HOLC, and the Federal Home Loan Board Bank (FHLBB), the federal government crafted a national set of standards for assessing mortgage risk. Through its 1935 City Survey Program, the HOLC gathered data about neighborhoods from approximately 239 cities and compiled the results into a rating system ranging from A to D. Communities with A ratings represented the best investments for homeowners and banks alike; B, neighborhoods that were still desirable, C, those in decline, and D, areas considered hazardous. "A" communities generally had access to better amenities such as better schools, parks, shopping, transportation and were therefore more desirable. "D" communities generally were located near less desirable features such as industrial properties and they had fewer and lower quality amenities." To visually capture these rankings, the HOLC then turned these ratings into color-coded maps, using green for A, blue for B, yellow for C, and red for D – the origin of the term “redlining.”

Many researchers have stated the HOLC maps were more a consequence of existing ordinary and discriminatory lending practices as opposed to being a cause for them. Still, the spatial isolation could make it a self-fulfilling prophecy over time. Many have stated the ratings were just a description of the current state of the real estate cycle for each neighborhood. A "D" area could be revitalized, redeveloped into a "B" area. If that area improved with the addition of more public transportation, parks, schools, shopping, it could become an "A" area. This is what has happened in downtown Los Angeles and other areas such as Boyle Heights which some refer to as gentrification. Areas which were in a then D zone are now a B zone. The reverse has also happened. Some areas which were B are now D. Real estate risk constantly changes.

Others have shown how the HOLC grades were more a function of factors such as housing condition, residential density, and housing type, as opposed to solely ethnic and racial composition. If the ethnic and racial compositions were not included in the maps, it would not have affected their accuracy in determining loan risk. Over time some of these ratings became more associated with race and immigration status than unbiased risk. The term "red zone" ended up having a connotation of POC, immigrants living in poor areas. Generally poorer people, people of color and immigrants lived in the C, D areas because it was less expensive. Over time the redlining caused less investment in C, D areas and more in A, B areas causing a greater divide between the areas. As people were pushed out of more expensive A, B areas and into C, D areas, those areas became A, B areas.

It must be noted that the actual HOLC maps never stated "D is a black area" or "D is an immigrant area." There were worksheets prepared by individuals which were used to determine the risk of each specific area. Those worksheets included many factors and descriptions including the following from top to bottom (see worksheet for an area of Los Angeles below), population, class and occupation, nationalities, income, sometimes "negro" %, building type, size, age, condition, owner/tenant % occupancy, home price bracket, sales demand, predicted price trend, sales demand, new construction, rate of sale of new construction, overhang of HOLC properties, description and characteristic of area. It's important to note that the maps only covered 239 cities. We have 108,000 cities in the US. The entire US was never mapped. Only .2% of cities were mapped, 1/5th of 1%. It's clearly impossible for the mapping of only .2% to affect all cities today.

Today in real estate appraisal and analysis we use all of the above factors except race and nationality. It's a violation of the Fair Housing Act to consider or mention race or nationality because it would be discrimination. All of the other factors are good indicators of value and trends. Now the US Census does include race and whether or not someone is "foreign born." The census has nothing to do with real estate sales or loans. It's a population study.

That said the areas ended up correlating with higher populations of POC, immigrants and poor people based on affordability. There is a direct correlation between income and POC. Whites make more than Latinos and Blacks. People with more money buy more expensive homes in more expensive areas. If the government wants to correct the wealth gap, they need to fix the income gap. Appraisers can't do it. If one were to note today property in the four distinct phases or life cycles of real estate, one would probably find a higher percentage of POC, immigrants and poor people in those same areas because hazardous, run down, less desirable areas have lower rent and less expensive homes to buy. In some areas, it's all poor white people. The correlation is income and wealth. People buy or rent what they can afford based on their income. Wealth is tied to income. Race correlates with income. The correlation is NOT race = home valuation. The causation is income.
The Fair Housing Act of 1968 made redlining due to race illegal. It became "unlawful to discriminate in the terms, conditions, or privileges of sale of a dwelling because of race or national origin." A bank could no longer refuse to make loans in certain areas based on those specific factors. Banks can only refuse loans based on the credit, credit history, income, assets, debts, expenses of the buyer, borrower. Those were the only factors that ever mattered in relation to risk anyway.

I am using this example below because it specifically mentions race, nationalities. Not all of the worksheets noted it. It was up to the individual filling in the form. The race, nationality had no effect on the rating. It was just reporting. They could have omitted it and ratings would have been the same. We know that race, immigrant status, being poor correlated with the lower C and D ratings because they correlated with lower income, lower net financial worth, lower credit ratings which affects affordability. This is not to say one caused the other. This is just to aid in the explanation of what "redlining" was.


Another important thing to consider is most people in the "redlined" areas were renters. Generally these areas are 80% tenants. The people who owned the property were mainly white. White property owners were the ones being denied loans or charged more for the loans. POC property owners were in the minority but they were also denied loans or charged more. And again this is only for government backed loans. People still got loans on the properties from sub prime lenders. We still have sub prime lenders today who do riskier loans. Those riskier loans are for riskier borrows or properties. A risky borrower has little cash, poor credit, lots of debt, shorter confirmed work history, undocumented work history, little income showing on tax returns, income only from retirement funds or investment property... A risky property is located in a wildfire area, higher risk flood zone, lava zone, tornado zone, next to river/ocean/lake, landslide area, on an earthquake fault, condo development with a major lawsuit, condo development with insufficient repair funds, older property, property not in average condition, property that needs seismic word, property with tenants that refuse to move, property that is behind on property taxes... Notice all these risk factors have nothing to do with race or color. These are just loan risk factors. Any safe bank would consider all of these risk factors especially if they are offering and reselling government backed loans.

Mary Cummins of Animal Advocates is a wildlife rehabilitator licensed by the

Mary Cummins of Animal Advocates is a wildlife rehabilitator licensed by the California Department of Fish and Game and the USDA. Mary Cummins is also a licensed real estate appraiser in Los Angeles, California.


Google+ Mary Cummins, Mary K. Cummins, Mary Katherine Cummins, Mary Cummins-Cobb, Mary, Cummins, Cobb, wildlife, wild, animal, rescue, wildlife rehabilitation, wildlife rehabilitator, fish, game, los angeles, california, united states, squirrel, raccoon, fox, skunk, opossum, coyote, bobcat, manual, instructor, speaker, humane, nuisance, control, pest, trap, exclude, deter, green, non-profit, nonprofit, non, profit, ill, injured, orphaned, exhibit, exhibitor, usda, united states department of agriculture, hsus, humane society, peta, ndart, humane academy, humane officer, animal legal defense fund, animal cruelty, investigation, peace officer, animal, cruelty, abuse, neglect #marycummins #animaladvocates #losangeles #california #wildlife #wildliferehabilitation #wildliferehabilitator #realestate #realestateappraiser #realestateappraisal #lawsuit

Sunday, October 15, 2017

Thomas Brothers map Los Angeles, California, page, grid by Mary Cummins Real Estate Appraiser

The old Thomas Brothers Map,Los Angeles, Orange and San  Diego County Foldout Map, Los Angeles, California, page, grid, Mary Cummins, Real Estate Appraiser, Real Estate Appraisal, 1991, Rand McNally, cartography, maps, Thomas Brothers Guide, Thomas Bros, index, guide
The old Thomas Brothers Map,Los Angeles, Orange and San  Diego County Foldout Map, Los Angeles, California, page, grid, Mary Cummins, Real Estate Appraiser, Real Estate Appraisal, 1991, Rand McNally, cartography, maps, Thomas Brothers Guide, Thomas Bros, index, guide 

If you're an old school real estate agent, appraiser, heck, anyone who used to do a lot of driving before smart phones, you are familiar with the Thomas Guide maps. The Thomas Guide was started by cartographer George Coupland Thomas and his two brothers in 1915 to help travelers find their way around growing and frequently changing cities in the United States. 

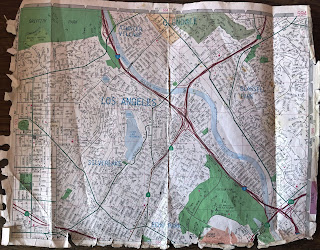
The Thomas Brothers developed a page and grid number system which they published in their yearly street guides. The page and grid layout is a national based tiling system. Map grids are 1/2 mile square, and are numbered from Grid A1 through Grid J7. The letters A to J are along the top of the map left to right and represent the columns. The numbers are on the sides of the map top to bottom and represent the rows. Below is a photo of one well used map page as an example. 

The idea of the map grid system probably came from the US Government Survey System from the National Atlas. This is based on the Public Land Survey System (PLSS) which is the surveying method developed and used in the United States to plat, or divide, real property for sale and settling. It uses a similar system based on townships and sections though with a slightly different section numbering system than Thomas Brothers maps.

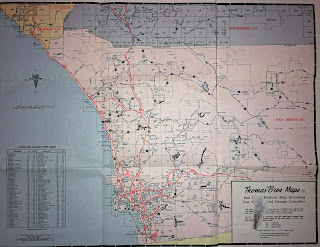
Below is a copy of the 1991 "Los Angeles, Orange and San  Diego County Foldout Map" which I bought along with a spiral bound map book with laminated pages.* It's the index, key, guide for the map book. It includes parts of Ventura and San Bernardino Counties. I also included the other side of that map which has the rest of Orange County, San Diego County, Riverside County. The green squares with numbers in them represent detail maps in the Guide. 

If you're looking for Thomas Guide Los Angeles, California map page and grid numbers for a specific address in the city of Los Angeles (city only and not the entire county of Los Angeles), input the address in the below links. Use Zimas first because it's quicker and easier. 

Zimas http://161.149.40.71/ Click "Address/Legal" top left. Scroll down a little top left and you'll see "Thomas Brothers Grid." 

You can also use Los Angeles City Building and Safety http://www.ladbs.org if Zimas is down. The direct page link https://www.ladbsservices2.lacity.org/OnlineServices/?service=plr Enter address then click on Parcel Profile Report for the address. Click the address which should be blue and underlined. Scroll down until you see Thomas Brothers Map Grid. The page and grid number is directly to the right. 

*Disclaimer: I'm sharing these old parts of paper maps under the Fair Use of Copyright under the Copyright Act to talk about the old mapping system and its history in Los Angeles, California. This is a 1991 map which is totally out of date and not useful as a map especially in the digital age of smart phones which have free maps with GPS. There are copies of Thomas Guide maps for Los Angeles County, California in the Library of Congress which are copyright free. This map is the same age. While Thomas Brothers own the copyright to printed maps they do not own the actual maps, map numbering system or the map page and grid numbers. 

The old Thomas Brothers Map,Los Angeles, Orange and San  Diego County Foldout Map, Los Angeles, California, page, grid, Mary Cummins, Real Estate Appraiser, Real Estate Appraisal, 1991, Rand McNally, cartography, maps, Thomas Brothers Guide, Thomas Bros, index, guide
The old Thomas Brothers Map,Los Angeles, Orange and San  Diego County Foldout Map, Los Angeles, California, page, grid, Mary Cummins, Real Estate Appraiser, Real Estate Appraisal, 1991, Rand McNally, cartography, maps, Thomas Brothers Guide, Thomas Bros, index, guide

Wall size glass framed Thomas Guide map of Los Angeles county in an old LA Fire Dept museum near Olvera Street. It's about 6-7 feet tall.


Mary Cummins of Cummins Real Estate is a certified residential licensed appraiser in Los Angeles, California. Mary Cummins is licensed by the California Bureau of Real Estate appraisers and has over 35 years of experience.


Mary Cummins, Mary K. Cummins, Mary Katherine Cummins, Mary, Cummins, #marycummins #animaladvocates #losangeles #california #wildlife #wildliferehabilitation #wildliferehabilitator #realestate #realestateappraiser #realestateappraisal #lawsuit real estate, appraiser, appraisal, instructor, teacher, Los Angeles, Santa Monica, Beverly Hills, Pasadena, Brentwood, Bel Air, California, licensed, permitted, certified, single family, condo, condominium, pud, hud, fannie mae, freddie mac, fha, uspap, certified, residential, certified resident, apartment building, multi-family, commercial, industrial, expert witness, civil, criminal, orea, dre, brea insurance, bonded, experienced, bilingual, spanish, english, form, 1004, 2055, 1073, land, raw, acreage, vacant, insurance, cost, income approach, market analysis, comparative, theory, appraisal theory, cost approach, sales, matched pairs, plot, plat, map, diagram, photo, photographs, photography, rear, front, street, subject, comparable, sold, listed, active, pending, expired, cancelled, listing, mls, multiple listing service, claw, themls, historical appraisal, facebook, linkedin